A new interactive map shows which parts of the world have been hardest-hit by climate change, and which will bear the brunt over the next half-century.
ClimateEx was put together by geology professor Tomsz Stepinski and researcher Pawel Netzel, both of the University of Cincinnati.
It uses five decades' worth of weather and climate data collected from 50,000 weather stations around the Earth, including New Zealand. It shows not just how the climate has changed in that time, but also what's expected to happen by the year 2070, based on current trends.
The data includes not just temperatures, but rainfall, which Prof Stepinski says is often forgotten about when it comes to climate change.

"Climate has many components, including precipitation. People often consider temperature and precipitation separately, but our mathematical model includes both."
More heat in the atmosphere means more moisture and more energy - put those together and you have an increased likelihood of hurricanes and rainfall, with more variability in local weather from day to day.
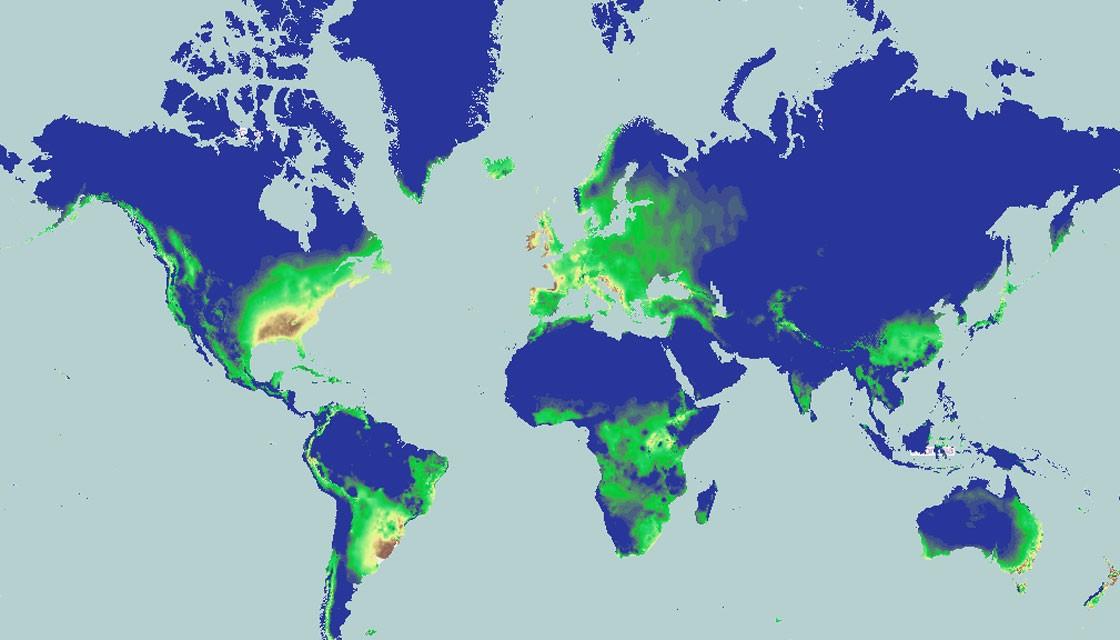
Setting the map to show the expected change between 2000 and 2070, it shows Central America and the northern part of South America are at risk of increased heat and rainfall, as are Papua New Guinea, southeastern China, the west coast of the US and most importantly for sea level change, Greenland and the Arctic.

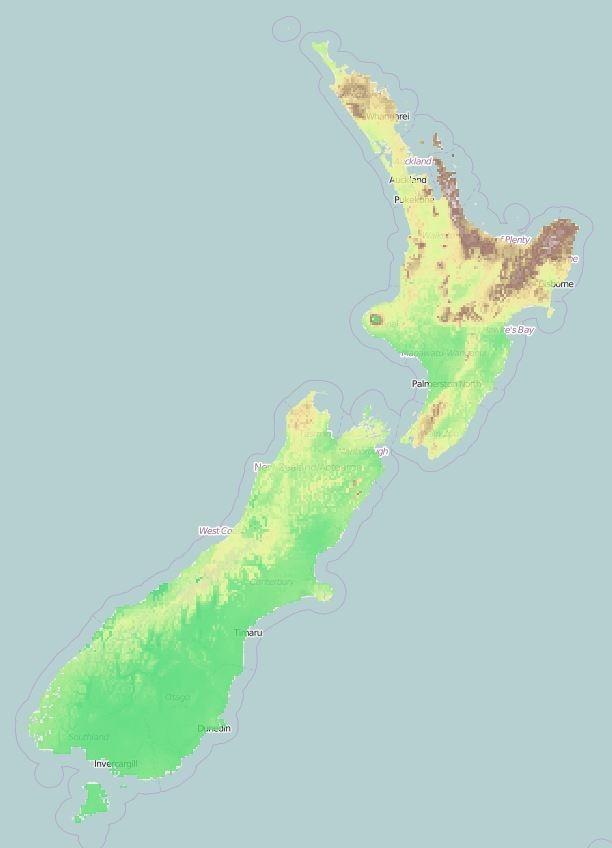
In New Zealand, the biggest changes are expected north of Whangarei, from Coromandel through the Bay of Plenty to the East Cape, the central North Island and Wairarapa.
The west coast of Waikato is also expected to get hotter and wetter, as well as the northern tip of the South Island.
- New Zealand one of five least vulnerable countries to climate change - study
- New Zealand will need to abandon some coastal areas - climate expert
"If you were looking at climate change at a scale of a million years, you wouldn't worry too much," Stepinski said. "But if you see dramatic changes on the order of a few decades, it's a big problem. Personally I'm not happy there are people who seem to disregard this as not much of a problem. It is a problem."
The map can also be used to see what cities have similar climates, now and in the future.

"ClimateEx enables an easy search for locations where climate change may lead to the occurrence of such extreme phenomena in the future," says Prof Stepinski. "The user simply indicates the location where tornadoes are presently frequent and ClimateEx finds all locations where in 50 years the climate will be conducive to tornadoes."
Clicking on Auckland shows its weather bears a resemblance to that of Wales and western Ireland, the southwest of France, Uruguay and even Croatia.
This makes it a also useful tool for people planning to migrate cities, says Prof Stepinski.
"It is easy to get answers to questions such as where in the world do we have a climate similar to Houston's? Where can I find a place with a climate as pleasant as Florida's?"
Scientists hope to keep global temperatures a maximum 2degC below pre-industrial levels.
Newshub.
